24 Mediation Analysis
At a glance
- Question
- Does a predictor affect a criterion through a third variable, the mediator?
- Design
- A causal model with a predictor, a mediator, and a criterion, ideally measured in that order
- Criterion
- Interval or ratio
- Predictor
- Interval, ratio, or dichotomous
- Mediator
- Interval or ratio
- Assumptions
-
- The causal order is correct
- No unmeasured confounders of the paths
- The mediator is measured reliably
- Null hypothesis
- The indirect effect is zero (ab = 0)
- Test statistic
- The indirect effect, ab, tested with a bootstrap confidence interval (the Sobel test is older and less powerful)
- Effect size
- The standardized indirect effect, and the proportion of the total effect that is mediated
- If conditions fail
-
- The model has more variables or more paths → Path analysis
- Include in the write-up
-
- The paths a, b, c, and c’ with their tests
- The indirect effect ab with its 95% bootstrap CI and the number of samples
- The proportion mediated, and whether the mediation is full or partial
Used to study how or why a predictor (independent variable) affects a criterion (dependent variable). Mediation analysis tests whether the effect of the predictor, X, on the criterion, Y, passes through a third variable, the mediator, M: X affects M, which in turn affects Y11 See Moderating vs. Mediating Variables. A moderator changes the strength of the relationship between X and Y. A mediator explains it. For example, a reading intervention may improve the students’ comprehension (Y) because it increases the time they spend reading (M)..
1 See Moderating vs. Mediating Variables. A moderator changes the strength of the relationship between X and Y. A mediator explains it. For example, a reading intervention may improve the students’ comprehension (Y) because it increases the time they spend reading (M).
Mediation is a causal model. It states that X comes before M, and M before Y, and that M is one of the reasons for the relationship between X and Y. The statistical analysis can show that the data is consistent with such a model, but it cannot prove that the model is correct22 See A Few Words About Causality.. The order of the variables has to come from theory and from the design of the study, for example by measuring the three variables at different times.
2 See A Few Words About Causality.
24.1 The Theory
24.1.1 Total, Direct, and Indirect Effects
The relationships between the three variables are described by three regression models. The first one, the total effect model, regresses the criterion on the predictor:
\hat{Y} = i_1 + cX
The slope c is the total effect of X on Y. The second model regresses the mediator on the predictor, and the third regresses the criterion on both the predictor and the mediator:
\hat{M} = i_2 + aX \qquad \hat{Y} = i_3 + c'X + bM
The slope a is the effect of X on M. The slope b is the effect of M on Y, holding X constant. The slope c' (read “c prime”) is the direct effect of X on Y, the part of the effect that does not pass through the mediator. The part that does pass through the mediator, the indirect effect, is the product of the two paths that lead through it, ab. Together, the direct and the indirect effects make up the total effect33 For regression models estimated by least squares on the same cases, the equation holds exactly.:
3 For regression models estimated by least squares on the same cases, the equation holds exactly.
c = c' + ab
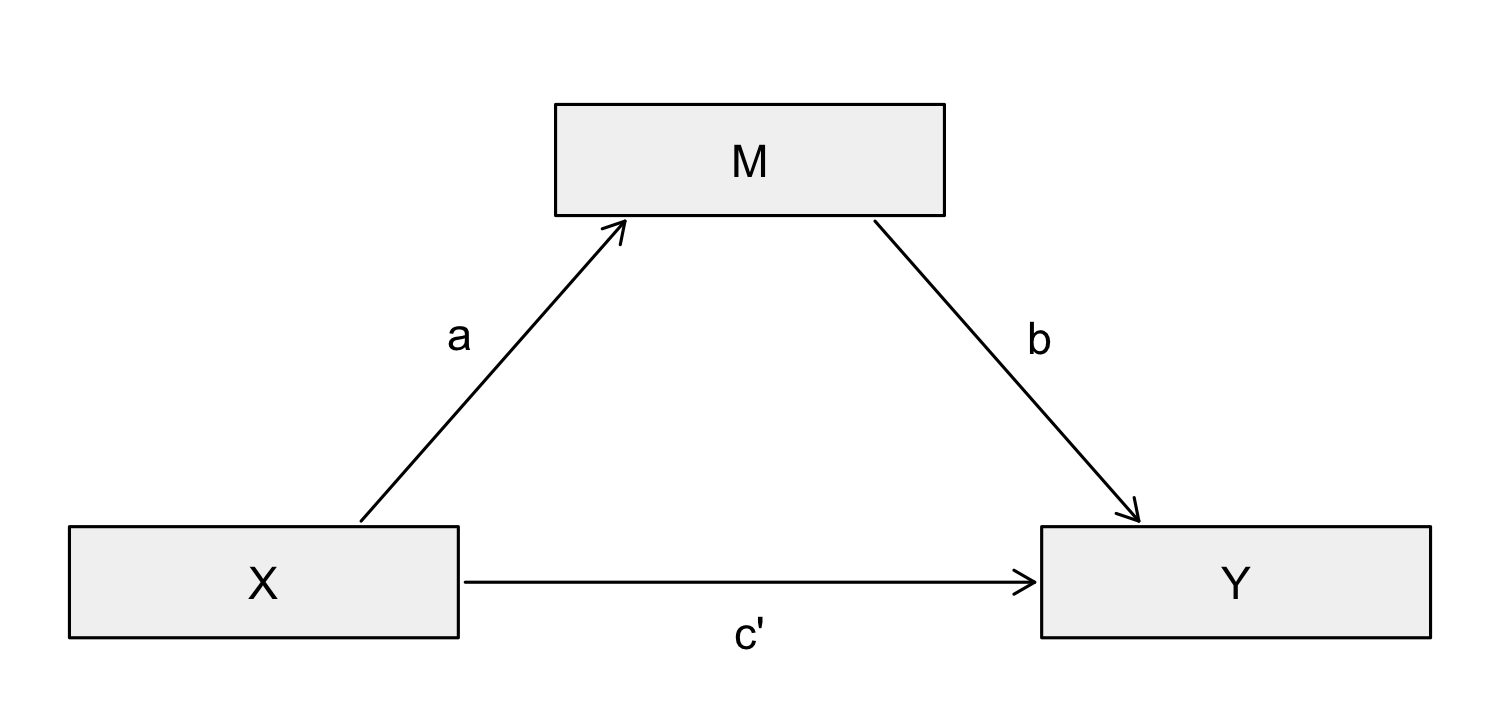
If M explains the whole relationship, the direct effect c' is zero, and the mediation is called complete or full. If c' is smaller than c but not zero, the mediation is partial: the mediator explains part of the relationship, and the rest passes through other paths not included in the model.
24.1.2 Testing the Indirect Effect
The classic approach to mediation, proposed by Baron and Kenny (1986), is a sequence of steps: show that X predicts Y (path c), that X predicts M (path a), and that M predicts Y when X is held constant (path b), and then compare c' with c. The approach is still widely used to describe the paths, but it has a weakness: it never tests the indirect effect itself. Modern practice tests the indirect effect, ab, directly. Two methods are common:
- The Sobel test divides the indirect effect by its standard error, z = ab / \sqrt{b^2 s_a^2 + a^2 s_b^2}, where s_a and s_b are the standard errors of a and b. It assumes that the product ab is normally distributed, which is usually not the case in small and medium samples, and it has little power;
- Bootstrapping draws thousands of samples, with replacement, from the data, and computes the indirect effect in each one. The distribution of these values shows how much the indirect effect varies from sample to sample, and its middle 95% is a confidence interval. If the interval does not include zero, the indirect effect is significant. Bootstrapping makes no assumption about the shape of the distribution of ab, and is the recommended method.
Of note is the fact that a significant total effect is not required for mediation. When the direct and the indirect effects have opposite signs, they can cancel each other out, and the total effect can be close to zero even when the indirect effect is real.
24.1.3 Effect Size
The indirect effect is expressed in the units of Y, which makes it hard to compare across studies. Two measures are common:
- The standardized indirect effect, ab computed on standardized variables, the change in Y, in standard deviations, for one standard deviation change in X, through M;
- The proportion mediated, ab / c, the share of the total effect that passes through the mediator. It is easy to understand, but unstable in small samples and meaningless when c is close to zero.
24.2 Assumptions
Mediation analysis is built on regression models, and has their assumptions: linear relationships, independent observations, and normally distributed residuals with constant variance. It also rests on causal assumptions that the data cannot check:
- The causal order is correct
- Supported by theory, by the design of the study, and by measuring X, M, and Y at different times;
- Violated when Y causes M, or when the variables affect each other.
- No unmeasured confounders
- Supported by random assignment of X and by including in the models the variables that could affect both M and Y;
- Violated when a variable not in the model affects both M and Y44 Random assignment of X does not protect the path from M to Y, because the mediator is not assigned..
4 Random assignment of X does not protect the path from M to Y, because the mediator is not assigned.
- The mediator is measured reliably
- Supported by using instruments with good reliability;
- Violated when M is measured with error, which underestimates the indirect effect and overestimates the direct effect.
24.3 The Study
A university’s wellness center wanted to understand why students who exercise report less stress. One explanation is that exercise improves sleep, and better sleep reduces stress. At the beginning of the semester, 150 students reported how many hours per week they exercised. A month later, they rated the quality of their sleep over the past month (from 0 to 20, higher meaning better sleep). At mid-semester, they completed a perceived stress questionnaire (from 0 to 40)55 Measuring the variables in this order supports, but does not prove, the causal order of the model.. The data set66 Column labels are: student, exercise, sleep, and stress. was made up for this example. The first few rows of the data set are shown in Table 24.1.
5 Measuring the variables in this order supports, but does not prove, the causal order of the model.
6 Column labels are: student, exercise, sleep, and stress.
| Student | Exercise (hours) | Sleep quality | Stress |
|---|---|---|---|
| 1 | 6.3 | 9 | 17 |
| 2 | 8.4 | 11 | 16 |
| 3 | 4.5 | 11 | 14 |
| 4 | 3.8 | 10 | 24 |
| 5 | 3.0 | 11 | 28 |
| 6 | 3.4 | 11 | 20 |
    exercise          sleep           stress
 Min.   : 0.200   Min.   : 2.00   Min.   : 0.00
 1st Qu.: 2.300   1st Qu.: 9.00   1st Qu.:16.00
 Median : 3.550   Median :11.00   Median :21.00
 Mean   : 4.169   Mean   :11.15   Mean   :20.55
 3rd Qu.: 5.775   3rd Qu.:13.00   3rd Qu.:25.00
 Max.   :13.800   Max.   :20.00   Max.   :37.00
exercise sleep stress
exercise 1.000000 0.5989280 -0.4966900
sleep 0.598928 1.0000000 -0.5859241
stress -0.496690 -0.5859241 1.0000000The three variables are correlated in the directions the model expects. Exercise is positively correlated with sleep quality (r = 0.60) and negatively with stress (r = -0.50), and sleep quality is negatively correlated with stress (r = -0.59).
Hypotheses. The question of the study is about the indirect effect of exercise on stress, through sleep:
- Null hypothesis (H0): In the population, the indirect effect of exercise on stress through sleep quality is zero (ab = 0).
- Alternative hypothesis (H1): The indirect effect is different from zero (ab \neq 0).
Decision criteria. The significance level is set at \alpha = .05. The indirect effect is tested with a 95% bootstrap confidence interval, based on 5,000 bootstrap samples. H0 is rejected if the interval does not include zero. The paths a, b, c, and c' are tested with the usual t-Tests of the regression coefficients.
24.3.1 The Three Regressions
             Estimate Std. Error   t value     Pr(>|t|)
(Intercept) 25.693041  0.8803689 29.184405 2.873602e-63
exercise    -1.232741  0.1770677 -6.961976 1.016587e-10
Estimate Std. Error t value Pr(>|t|)
(Intercept) 7.7245963 0.44850555 17.222967 3.547724e-37
exercise 0.8207716 0.09020745 9.098711 5.694543e-16 Estimate Std. Error t value Pr(>|t|)
(Intercept) 31.9855327 1.393033 22.961072 1.784343e-50
exercise -0.5641366 0.201856 -2.794748 5.887380e-03
sleep -0.8146046 0.147297 -5.530354 1.422164e-07The three models give the four paths of the mediation model:
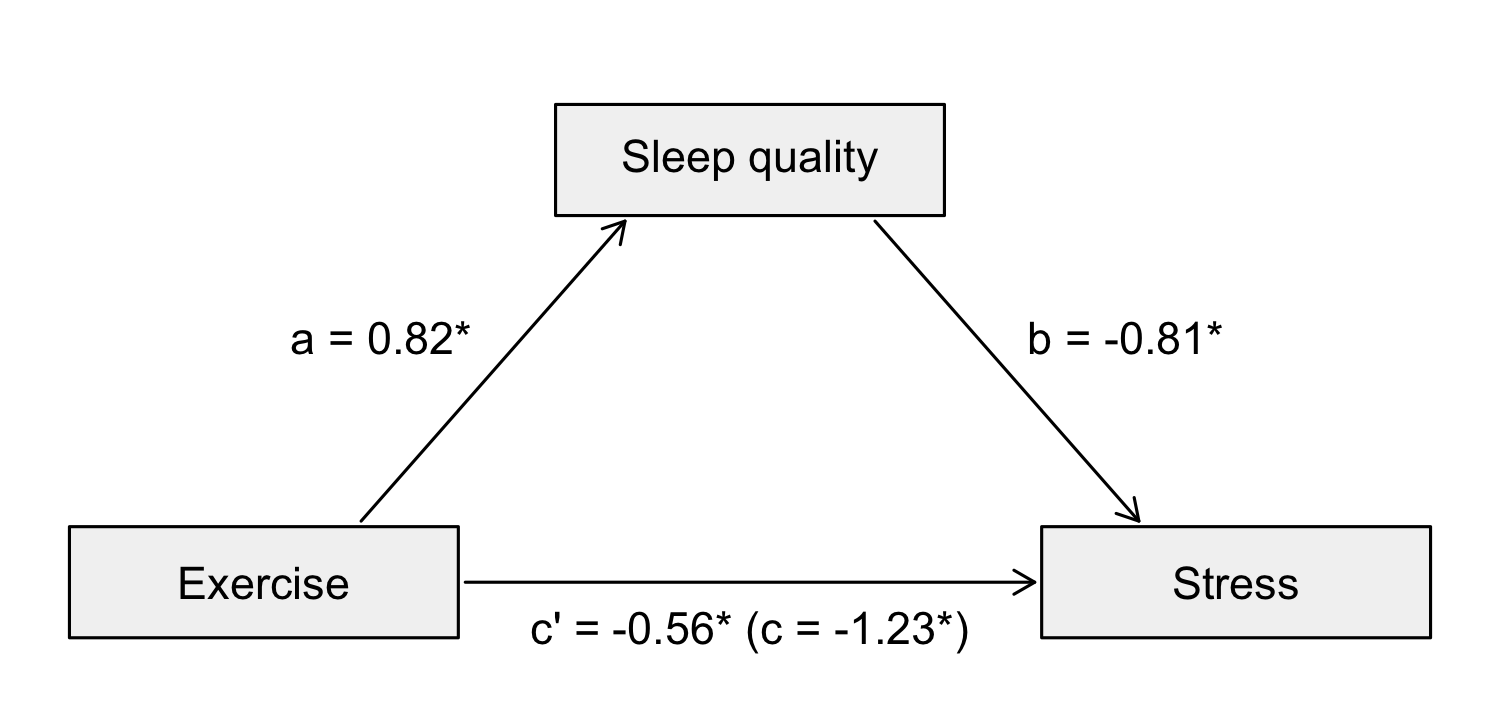
- Total effect, c = -1.23, t(148) = -6.96, p < .001. Each additional hour of exercise per week is associated with 1.23 points less stress;
- Path a, a = 0.82, t(148) = 9.10, p < .001. Each additional hour of exercise is associated with 0.82 points better sleep quality;
- Path b, b = -0.81, t(147) = -5.53, p < .001. For students who exercise the same number of hours, each additional point of sleep quality is associated with 0.81 points less stress;
- Direct effect, c' = -0.56, t(147) = -2.79, p = .006. For students with the same sleep quality, each additional hour of exercise is associated with 0.56 points less stress.
The indirect effect is the product of paths a and b, ab = 0.82 \times (-0.81) = -0.6777 As expected, the total effect is the sum of the direct and the indirect effects: -0.56 + (-0.67) = -1.23 = c..
7 As expected, the total effect is the sum of the direct and the indirect effects: -0.56 + (-0.67) = -1.23 = c.
24.3.2 Testing the Indirect Effect
Let’s first compute the Sobel test, to see how it works:
[1] -4.725863[1] 2.291401e-06The Sobel test finds a significant indirect effect, z = -4.73, p < .001. Now, the recommended test, the bootstrap confidence interval:
BOOTSTRAP CONFIDENCE INTERVAL CALCULATIONS
Based on 5000 bootstrap replicates

CALL :
boot.ci(boot.out = my.boot, type = "perc")

Intervals :
Level     Percentile
95%   (-0.9702, -0.3776 )
Calculations and Intervals on Original Scale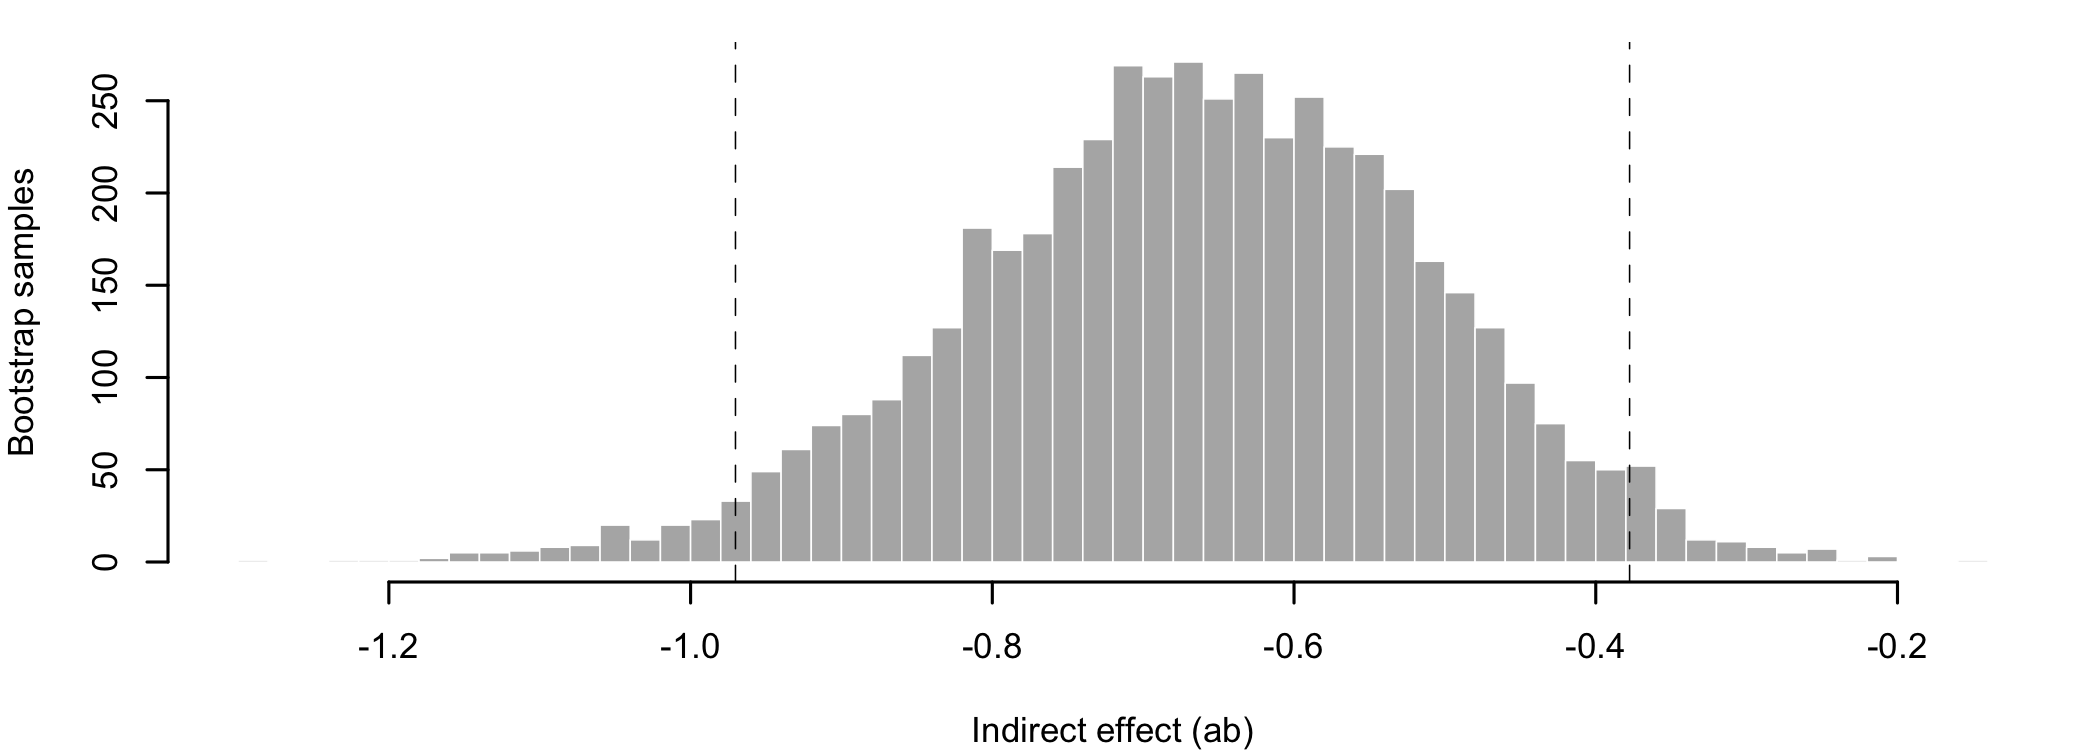
Decision. The 95% bootstrap confidence interval of the indirect effect runs from -0.97 to -0.38 and does not include zero (Figure 24.2). The null hypothesis is rejected and the alternative hypothesis accepted: exercise has a significant indirect effect on stress, through sleep quality. Because the direct effect is also significant, the mediation is partial: better sleep explains part, but not all, of the relationship between exercise and stress.
Effect size. The standardized indirect effect is -0.27: one standard deviation more of exercise is associated, through sleep, with 0.27 standard deviations less stress. The proportion mediated is ab / c = (-0.67) / (-1.23) = 0.54: about 54% of the relationship between exercise and stress passes through sleep quality.
24.3.3 Reporting the Results
Mediation results are usually reported with a diagram of the model, showing the coefficients of the paths (Figure 24.3), together with the indirect effect and its confidence interval.
A mediation analysis tested whether sleep quality mediated the relationship between weekly exercise and perceived stress in 150 university students. Exercise predicted better sleep quality, a = 0.82, t(148) = 9.10, p < .001, and better sleep quality predicted lower stress when exercise was controlled, b = -0.81, t(147) = -5.53, p < .001. The indirect effect of exercise on stress through sleep quality was significant, ab = -0.67, 95% bootstrap CI [-0.97, -0.38], based on 5,000 samples, and accounted for 54% of the total effect, c = -1.23. The direct effect of exercise on stress remained significant, c’ = -0.56, t(147) = -2.79, p = .006, indicating partial mediation.
24.4 Summary
Mediation analysis divides the effect of a predictor on a criterion into a direct effect and an indirect effect that passes through a mediator. The indirect effect is the product of two paths, from the predictor to the mediator and from the mediator to the criterion, and is best tested with a bootstrap confidence interval. In the wellness study, about 54% of the relationship between exercise and stress passed through better sleep.
Of note is the fact that the model is causal, while the data is correlational. The students were not assigned to exercise or to sleep well, and other variables, such as their general health or their workload, could affect all three. The order in which the variables were measured makes the model plausible, but a model with the same variables in a different order could fit the data as well. Mediation is a special case of path analysis, which extends the same ideas to models with more variables and more paths.